
Terminology of HPLC Chromatogram
- sl10x.in
- June 23, 2024
- No Comments
- 11:13 am
Terminology of HPLC Chromatogram
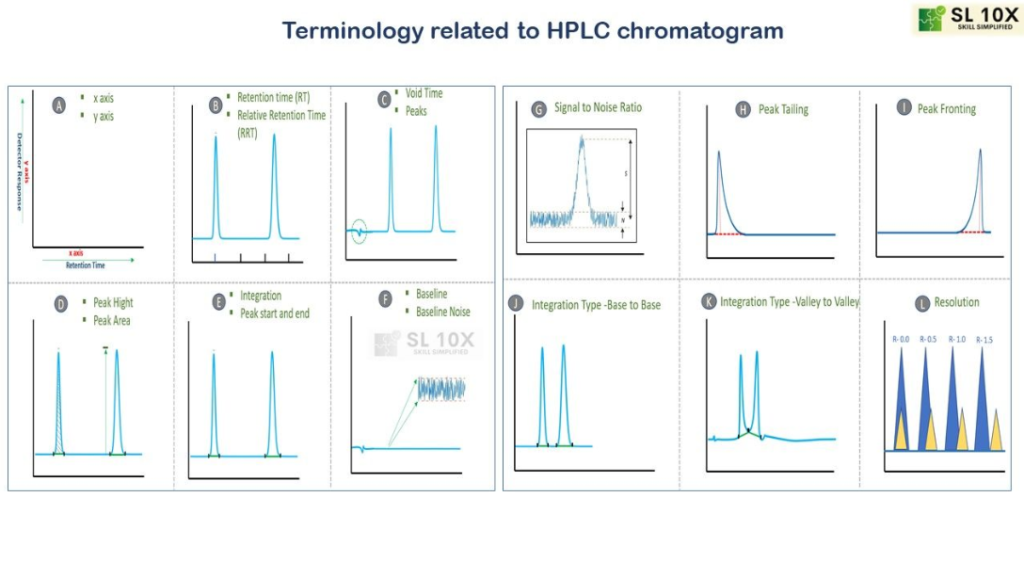
Chromatogram: A chromatogram is a graphical representation where the y-axis indicates detector response corresponding to concentration, while the x-axis signifies time in minutes.
Retention Time and Relative Retention Time: Retention time refers to the duration between sample injection and the analyte's detection by the sensor. Relative retention time compares and reports one analyte's retention time against another's, aiding in qualitative analysis in chromatograms.
Void Time (t0): The void time is the retention time of an unretained component, typically indicated by the initial baseline disturbance caused by the sample solvent's elution.
Peak Area and Peak Height: The area beneath the peak is termed the peak area, while the distance from the baseline to the peak's top is the peak height. These parameters are vital in quantitative analysis and are linked to determining analyte concentration in unknown samples.
Signal to Noise Ratio (S/N): The S/N ratio compares the analyte signal to the baseline noise. Noise is measured between two lines bracketing the baseline, while the signal is measured from the midpoint of the baseline to the peak's top. Both the analyte peak signal and the baseline noise contribute to the S/N ratio.
Peak Tailing: In ideal chromatography, peaks exhibit a symmetrical, Gaussian-shaped structure with a flat baseline. Deviations from this ideal result in peak tailing, where the latter half of the peak appears wider than the first half. The tailing factor, typically falling between 0.9 and 1.4, indicates the symmetry of the peak, with a value of 1.0 signifying perfect symmetry.
Peak Fronting: The opposite of peak tailing, peak fronting occurs when the first half of the peak appears wider than the latter half, deviating from the Gaussian shape.
Integration Type Base to Base: Proper quantitation relies on correct peak integration, requiring symmetrical peaks with a Gaussian shape and a flat baseline. Base to base integration, where peaks are well-separated, is the preferred method in such instances.
Integration Type Valley to Valley: Alternatively, valley to valley integration is used when associated peaks are not well-separated.
Resolution: Resolution measures the separation between two peaks with different retention times in a chromatogram. It serves as a key indicator of the efficiency of chromatographic separation and will be further discussed in upcoming sections.
Peak Integration, Peak Start, and End: Peak integration involves defining the peak's start and end to calculate its area and other chromatographic parameters accurately. A well-defined peak shape is crucial for proper integration, ensuring accurate and precise results.
Baseline and Baseline Noise: The baseline on a chromatogram records detector responses when only the mobile phase passes through the column into the detector. An ideal detector baseline is flat, indicating minimal noise in the signal.

sl10x.in
Category Post
Newsletter
Elit tellus, luctus nec ullamcorper mattis, pulvinar dapibus leo.